Flipster Crypto Weekly (18 October)

18 October 2024
Uptober for the crypto markets?
Crypto markets began the week on a downward trend, mirroring last week’s decline. However, Bitcoin stood out, surging in pricing even as most cryptocurrencies fell. Bitcoin exchange-traded funds (ETFs) reported a substantial influx of new capital, with inflows reaching $555.9 million. This marked the largest single-day inflow into Bitcoin ETFs since June, underscoring renewed investor interest and confidence in Bitcoin as an asset.
Bitcoin (BTC)
Weekly performance: +12.71%
Year-to-date (YTD) performance: +62.12%
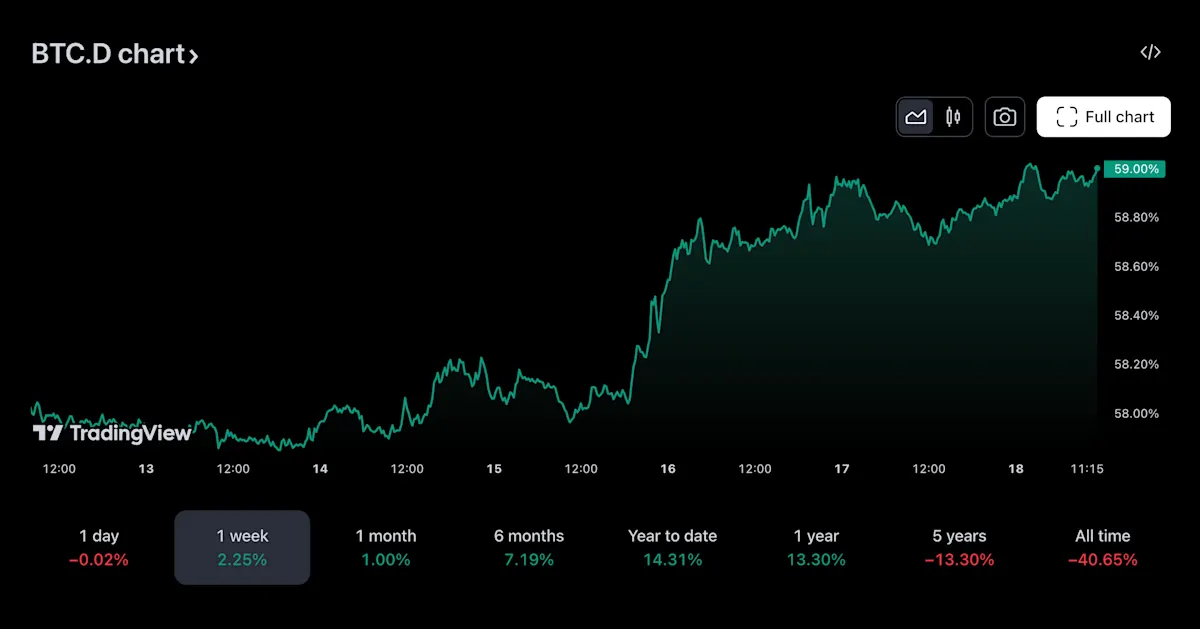
Bitcoin (BTC) demonstrated resilience this week, outperforming most other cryptocurrencies and pushing its dominance in the market to nearly 60%. This marks a 3-year high and highlights the significant influence Bitcoin continues to hold in the crypto markets.

Bitcoin (BTC) Dominance Chart. Source: TradingView
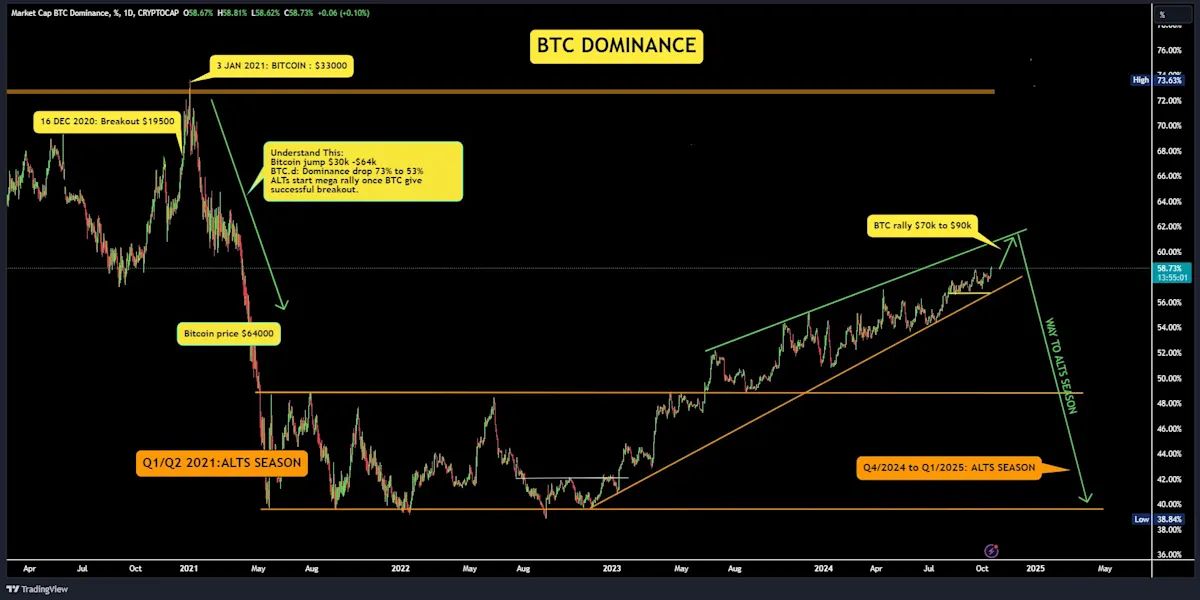
In the previous market cycle, Bitcoin dominance peaked in early 2021 before altcoins experienced a substantial rally in the following months. While historical patterns do not guarantee future performance, the similarity to past trends suggests the possibility of an upcoming altcoin season, should market conditions align. After all, history does not repeat itself, but it often rhymes.

Bitcoin more than doubled in price but its dominance fell as altcoins outperformed. Source: Twitter @Ashcryptoreal
From a technical analysis perspective, BTC has successfully broken above the $64,300 resistance level, which it had tested multiple times in recent months. However, the next critical level for BTC is around $68,300, where it encountered significant selling pressure in July. This area could pose a challenge again, as traders may look to take profits or hedge positions, leading to some resistance before further upside can be achieved.
Ethereum (ETH)
Weekly performance: +9.94%
Year-to-date (YTD) performance: +15.05%
Ethereum (ETH) is currently trading sideways, positioned just below its long-standing downtrend line. The presence of multiple upper wicks and doji candlesticks suggests that ETH is at a critical inflection point. A decisive breakout and sustained move above this 5-month downtrend line could signal further upward momentum for Ethereum, potentially shifting the market sentiment and inviting increased buying activity.
Solana (SOL)
Weekly performance: +9.79%
Year-to-date (YTD) performance: +50.00%
Solana (SOL) is currently trading above its 200-day moving average, finding support at this key technical level. The critical resistance to watch is the $161 price level, which has acted as a barrier since early August. A successful breakout above this level in the upcoming week would signal a bullish trend for Solana, indicating potential upward momentum.
POPCAT
As memecoins continue to dominate the conversation, let’s analyze one of the popular ones, POPCAT. Earlier in the week, POPCAT declined, finding support at its 21-day moving average before rebounding and moving back above the 10-day moving average. The price action appears constructive, characterized by controlled pullbacks followed by strong recoveries.
POPCAT continues its uptrend, with prices trading above key moving averages. Additionally, the short-term moving averages are trending upward and maintaining their position above the long-term moving averages, signaling sustained bullish momentum.
Disclaimer: This material is for information purposes only and does not constitute financial advice. Flipster makes no recommendations or guarantees in respect of any digital asset, product, or service. Trading digital assets and digital asset derivatives comes with significant risk of loss due to its high price volatility, and is not suitable for all investors.